
-
HOW TO BE THE CENTER OF ATTRACTION WHEREVER YOU ARE: Become the Person Everyone Remembers, Respects, and Wants to Be Around
Original price was: ₹499.00.₹399.00Current price is: ₹399.00. -
How to Be Liked by Everyone You Meet: Master the Art of Winning Hearts and Building Meaningful Connections
Original price was: ₹499.00.₹399.00Current price is: ₹399.00. -
Surviving and Thriving in Market Turmoil: Essential Trading Strategies for Enterprising Traders in Stock, Currency, Commodity, and Crypto Markets
Original price was: ₹499.00.₹399.00Current price is: ₹399.00. -
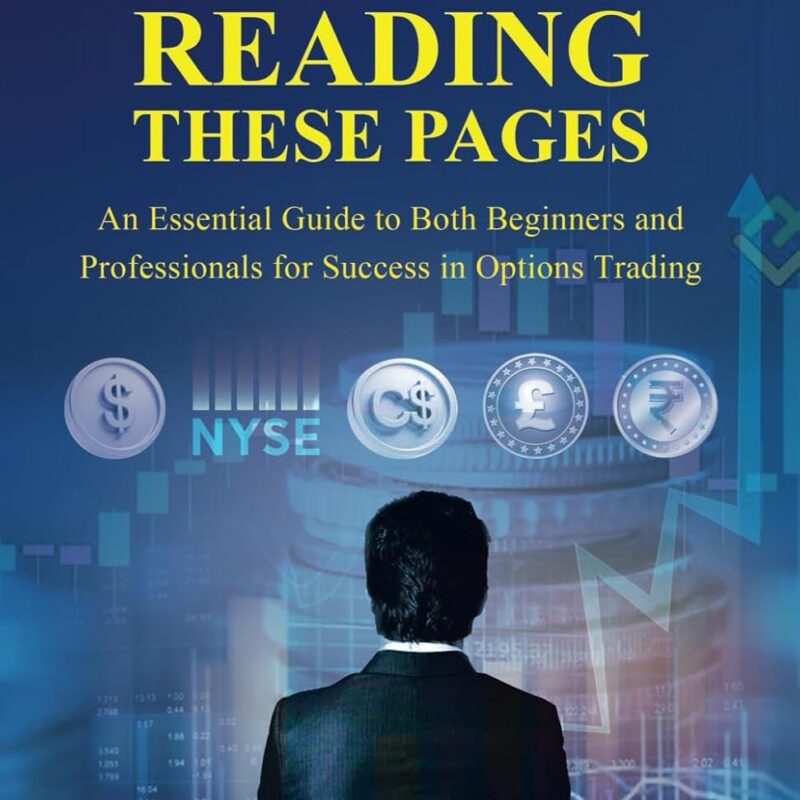
OPT TO OPTIONS TRADING AFTER READING THESE PAGES
Original price was: ₹499.00.₹310.00Current price is: ₹310.00. -
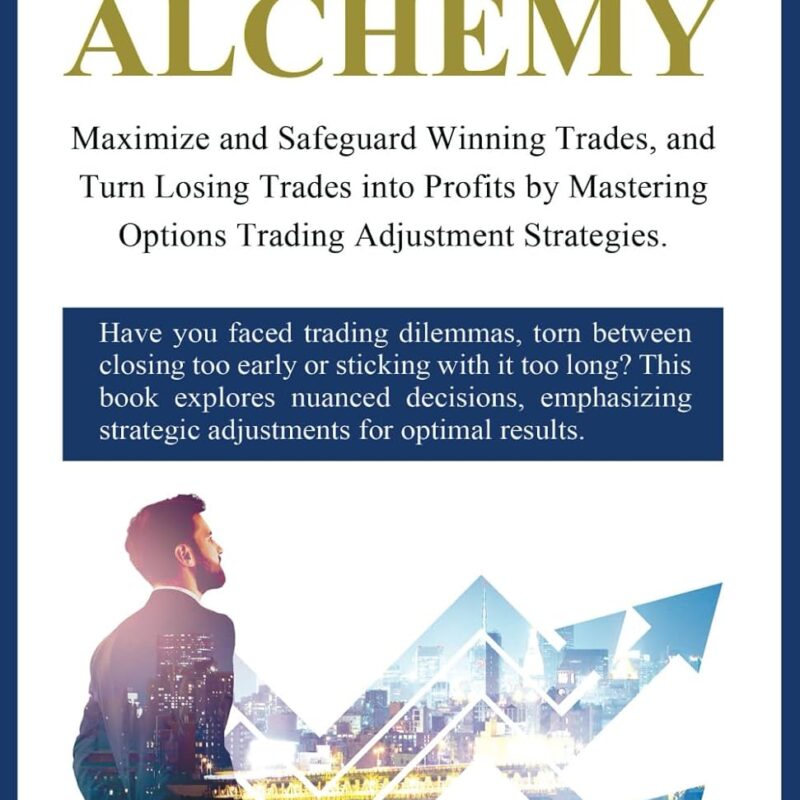
OPTIONS ALCHEMY: Maximize and Safeguard Winning Trades, and Turn Losing Trades into Profits by Mastering Options Trading Adjustment Strategies
Original price was: ₹499.00.₹349.00Current price is: ₹349.00. -
TRADING SMARTER, NOT HARDER: A Comprehensive Guide to Maximize Profit in Stock and Currency Trading for Beginners and Professionals
Original price was: ₹499.00.₹349.00Current price is: ₹349.00. -
Don’t Trade Before Learning These 14 Candlestick Patterns
Original price was: ₹499.00.₹310.00Current price is: ₹310.00.